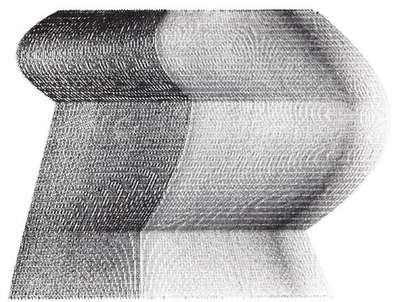
A two-color plotter graphic made with the Amherst College IBM 1130 computer and plotter. The main program (called TRPL) was written by Robert Mallary. A curve fitting subroutine (called XFIT) was written by Dr. Roger Ehrich. The program interpolates a series of lines between a given “master” line on the left and another such line on the right. A third master line is used to graph the spacing between the lines. The Moiré patterns result from the visual interaction between the spaced lines with a peculiarity of the pen. It is restricted by a system program to moving either vertically, or horizontally, or at some increment of 45 degrees.
»Two-Color Plotter Graphic«
by Robert Mallary
| i |

| creators: | Robert Mallary |
| title: | Two-Color Plotter Graphic |
| year: | 1973 |
| material: |
drawing, computer-generated Plotter Graphic, 4×5 inches |
| artwork type: | drawing |
Description
Artists
Illustrations
Comments
enter new comment

